Not only in pharmaceuticals but many industries are using Root Cause Analysis (RCA) tool. Root Cause Analysis (RCA) is a technique used to find out the root cause of the problem and help to resolve the problem.
Root Cause Analysis (RCA) enhances the quality of the investigation of the problem.
Root Cause Analysis (RCA) Techniques:
There are types of root cause analysis (RCA) techniques, that help to find the root cause of the problem, Why-Why Analysis or 5 Why analysis, Brainstorming, Process mapping and the Ishikawa diagram (well known as the cause and effect diagram or Fishbone diagram).
To find out the exact cause of the problem a single tool or combination of tools can be used.
Why-Why Analysis or 5 Why Analysis:
When it comes to the manufacture or analysis of pharmaceutical products, 5 why can be very useful and effective. It works by simply asking the question and finding its exact answer.
5 Why is one of the tools to get the final root cause of the problem. It works as its name is used. It is a set of questions, you should ask 5 why’s sequentially to yourself to get the final cause.
Brainstorming:
Brainstorming is one of the most popular tool in RCA. When the group meets, all the information is presented and all the facts laid out, and the group continues to look for any other potential causes.
In short, a team of experts meets to determine the exact cause of the deviation and to propose a solution.
Brainstorming is a meeting where anyone can share their ideas and the goal of the meeting remains the same to find out the problem’s cause. On the basis of gathered information or ideas, it can be easy to evaluate the cause of the problem.
Process Mapping:
Process mapping is also an RCA tool. This tool represents the visual representation of the process. In this tool, we can check the entire process on each step. The probability of getting the potential root cause of the problem is increased through visual presentation.
The process mapping technique is a great way to identify what might contribute to a problem by breaking it down step-by-step.
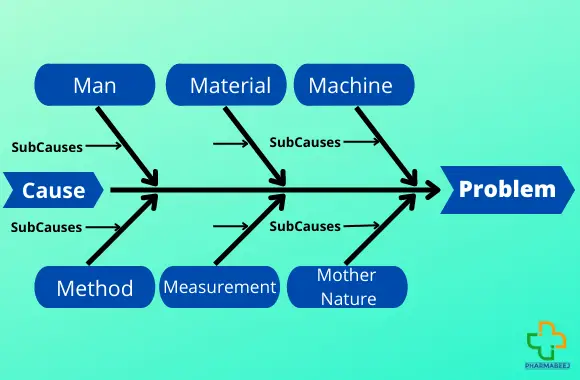
Ishikawa Diagram/Cause and Effect analysis/Fishbone Diagram:
A Fishbone Diagram or cause-and-effect diagram includes categories that differ based on the scenario. On the diagram, “people” always represent a category along with methods, machines, and materials. This shows each has its own potential causes.
This tool is categorized into 6M’s, Man, Material, Machine, Method, Measurement, and mother nature or environment.

Man: The person who is involved in the activity.
Material: It contains Raw materials, Packing material, and the Items involved in the process.
Machine: Equipment or Instrument that is involved in the process.
Method: SOP, STP, guidance documents and other procedures that are involved in the process.
Measurement: Measurement of product quality is based on data generated during the measurement process.
Mother Nature (Environment): Conditions such as temperature, humidity, pressure differential, and the environment in which the process or activity takes place are included.
These are the main causes but sub-causes are also a part of the Ishikawa diagram to get the root cause.
When the investigative team completes the diagram, it will have an outline for the investigation report.
These are the tools used while the root cause analysis (RCA) of the problem.
Also Read:
- Why is Data integrity important in pharma?
- Preparation and standardization of 0.1N perchloric acid
- Computer system validation (CSV) as per FDA
- Cleaning validation basic factors
- Accelerated stability testing and shelf-life calculation
- What are the Checkpoints of OOS Investigation?
- Laboratory investigation of aberrant results part-3
Refer YT Channel: Pharmabeej